
Monitoring dashboard with metric charts and event logs

Observability · Technical note

Observability without noise: metrics, logs, and traces that are actually used

How to reduce data volume without losing diagnostic capability

Storing everything is easy. The problem appears when you have to open a dashboard at three in the morning and find, among thousands of series, the one that explains why a service stopped responding. In most of the platform teams we review, the volume of metrics, logs, and traces grows faster than the actual ability to interpret them. And the cost of storage, sooner or later, starts to weigh more than the usefulness.

A criterion that works: classify each signal by its operational value, not by how cheap it is to emit. The metrics used in a specific incident—latency per endpoint, error rate per dependency, saturation of a connection pool—deserve long retention and controlled cardinality. Debug logs that no one consults after deployment can live for hours, not weeks. Distributed traces are useful when there is a jump between services that cannot be explained with metrics; outside that case, sampling is reasonable.

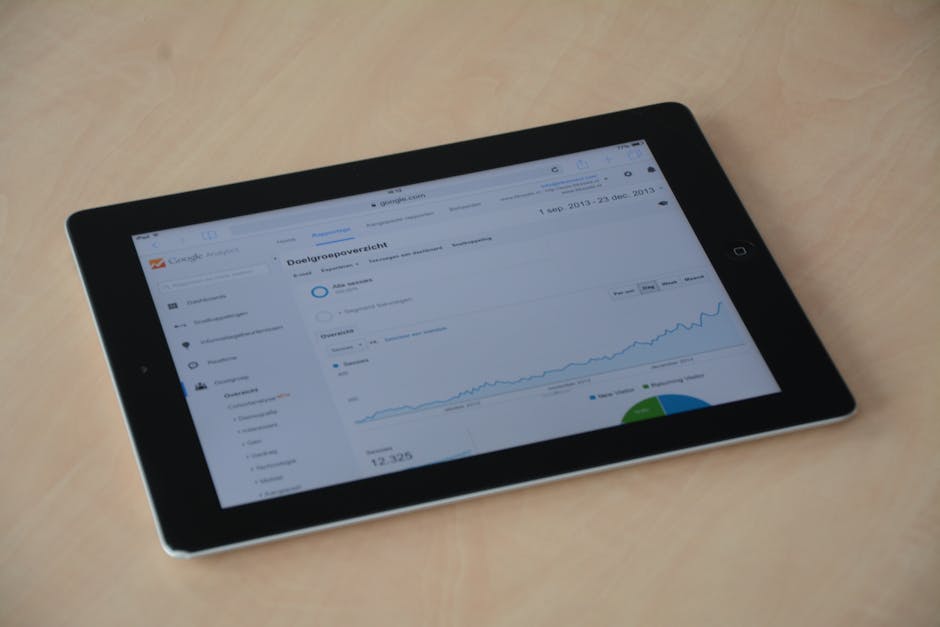
On real dashboards this translates into a few well-chosen series. A dashboard with twenty charts is usually less useful than one with five, each answering a specific question: is latency rising, is some resource running out, is a dependency failing more than yesterday? When the panel tries to cover everything, the operator wastes time deciding what to look at first. That prior selection is the team's job, not the on-call person's.

Regarding traces, the discussion repeats: store 100% or sample? It depends on traffic and on how much you need to reconstruct a specific case. Rate-based sampling, combined with full capture when there is an error, covers most diagnostics without inflating the backend. What does not work is sampling without criteria and discovering in the middle of an incident that the trace you needed was not stored.

Retention decisions are also cost decisions. Defining how long each type of signal lives —and who can change it— prevents storage from growing out of inertia. There is no single formula; there are habits: periodically reviewing what is being stored, what is actually queried, and what can be discarded without losing response capability.

Observability without noise: metrics, logs, and traces that are actually used

Before going further, it is worth clarifying the scope. What follows is not a tool guide or a vendor recommendation. It is a selection criterion: which signals are worth keeping when the volume of metrics, logs, and traces already costs more than it helps to diagnose. The dashboard and trace sampling examples are working scenarios, not screenshots of a real system.

Observability without noise: metrics, logs, and traces that are actually used

Buckingham Cloud is an independent blog, with no sponsorship. It is written by engineers who work with production infrastructure and document what works for them day to day: configurations that hold up, dashboards that can be read quickly, and comparisons made with hands on the keyboard.

There is no editorial team behind it or commercial team. Each entry is signed by someone who was in front of the incident, reviewed the logs, and noted what worked and what did not.

Who writes

Platform engineers and SREs

The notes on observability, message queues, and Kubernetes come from people who operate those systems. When an entry talks about metrics that are not used or traces that should be sampled, it comes from having looked at a dashboard at three in the morning searching for why a queue was growing without stopping.

How the material is chosen

Topics that come up in real work

The articles start from a specific problem: a consumer that cannot keep up, a legacy service that restarts when containerized, a cloud budget that slips away because of forgotten disks. If the topic has not been through production, it does not go in.

What is published

Configuration snippets and dashboard screenshots

Each entry includes configuration snippets, dashboard screenshots, and tool comparisons. No loose theory: what is shown is what was tested, with limitations and errors noted alongside.

Who it's for

Platform, SRE, and backend teams

The blog is intended for those who need to decide today: which signal to keep, which retention to apply, which metric to label per service. You can follow it by tags such as networking, storage, or CI/CD, or receive the weekly newsletter with the latest published content.

If you want to follow the upcoming posts on observability, queues, and instance costs, you can write to us or subscribe to the weekly newsletter.

Write to the team
Monitoring dashboard with metric charts and event logs

Observability without noise: metrics, logs, and traces that are actually used

When a queue starts to grow and consumers can't keep up, the problem is almost never a lack of data. It's a lack of clear signals. These are the views worth having on hand before opening the full dashboard.

Queue depth

How many messages are waiting and since when

Depth alone is misleading. A short spike resolves itself; a curve that climbs for hours indicates that the consumption rate has fallen below the publishing rate. It's worth looking at both together rather than depth in isolation.

Screen with configuration files and a highlighted change plan Consumer configuration

Prefetch and retries that actually hold up

A high prefetch speeds up consumption until one slow message blocks the entire batch. A low prefetch leaves the consumer waiting. The middle ground depends on the real processing time, not the one stated in the documentation.

Terminal with service manifests and usage metrics on screen Traces across services

Follow a message without storing all of them

Sampling traces is not losing information: it is choosing which ones are worth keeping. Those that cross more than two services and those that end in error usually contribute more than the rest of the daily volume.

Chart of cloud service costs with a breakdown by category Retention and storage

How long to keep each signal

Application logs are rarely queried after a couple of weeks. Aggregated metrics, on the other hand, remain useful for comparing quarters. Making retention uniform across everything is usually the most expensive and least useful decision.

Containers and services deployed in a cluster with startup logs Tagging by service

Without tags, the dashboard says nothing

A metric without the tag of the service that emits it forces you to cross-reference data by hand during an incident. Tagging at the source costs little and avoids that search when the clock is against you.

Monitoring dashboard with metric charts and event logs Thresholds and alerts

Alert on trend, not on value

A fixed threshold fires every time the system breathes. Alerting when the consumption rate falls below the publication rate for several minutes reduces noise without letting real degradation slip through.

Observability without noise: metrics, logs, and traces that are actually used

Independent technical log

This entry on observability and message queues is signed by the Buckingham Cloud editorial team, the same log that publishes notes on Kubernetes, Terraform, instance costs, and legacy service migration. There is no sponsorship behind the articles, nor external profiles endorsing what is written: what appears in each note comes from configurations, dashboards, and comparisons that the team reviews before publishing. If something in the text does not hold up against what was observed, it is corrected or marked as a sample scenario.

Questions about the content, corrections, or topic suggestions are received at hello@buckinghamcloud.com. The log does not maintain social media accounts or public team profiles; the contact channel is that email and the mailing address at Av. Corrientes 1235, Floor 12, Office 1204, Torre Corrientes Building, C1043 Buenos Aires, Argentina.

Cookie settings

We use cookies to keep the site stable, remember basic options, and understand which pages are useful. You can accept, reject, or review the settings before continuing.