
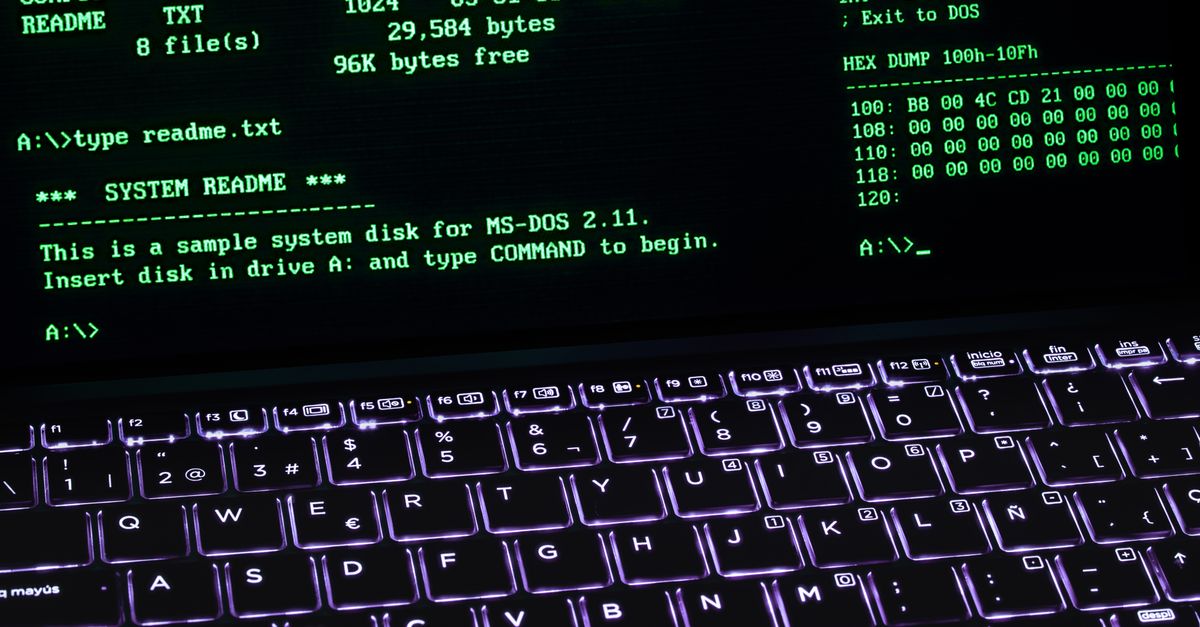
Terminal with Kubernetes manifests and resource usage metrics on screen

Production notebook

Kubernetes in production: resource limits that actually prevent outages

How to tune requests and limits without starving the pods

Resource limits in Kubernetes seem simple until a pod starts restarting for no apparent reason. This review compares poorly calibrated requests and limits with configurations that sustain variable workloads, shows manifest snippets, and explains how to read scheduler and kubelet events to distinguish memory shortage from CPU throttling.

It also discusses the most common mistakes when copying values from a test environment to production and which metrics should be monitored before touching the numbers. The starting point is usually the same: a node that begins to show high latency, pods restarting in a chain, and an observability dashboard where the spike appears right when no one was deploying.

Before intervening, it is worth checking the state of the nodes, the scheduler events, and the resource pressure reported by the kubelet. Distinguishing an OOMKill from CPU throttling completely changes the decision: in one case the memory limit is below what the process actually needs, while in the other the container is receiving fewer cycles than it believes it has.

A manifest with reasonable requests and limits should not be copied from one environment to another without review. Production workloads have bursts that tests do not reproduce, and values that worked in a small cluster stop being useful when traffic is distributed differently. The practical recommendation is to adjust one resource at a time, let the real workload run, and read the metrics again before the next change.

Kubernetes in production: resource limits that actually prevent outages

Resource limits in Kubernetes are not a formula you copy from a tutorial. What follows are clarifications we apply every time we review a cluster with pods restarting for no obvious reason: what we measure, what we do not promise, and when it is worth stopping to look at events before editing a manifest.

Nothing in this post comes from an ideal test bench. These are observations from clusters with variable load, nodes that degrade, and teams that inherit configurations written by someone else two years ago.

Kubernetes in production: resource limits that actually prevent outages

Buckingham Cloud is not a publication with a corporate byline. It is an independent technical log, unsponsored, sustained by engineers who document what actually runs in production. When an entry talks about resource limits in Kubernetes, it does not come from a manual: it comes from having seen pods restart at three in the morning because of a limit on memory inherited from a test environment.

The entry you are reading, about CPU and memory limits that actually prevent outages, follows that criterion. Every manifest fragment that appears in the text was tested before publication. The dashboard screenshots show real metrics from clusters in operation, and tool comparisons are made without commercial agreements involved. If something does not work in production, it is not published as if it did.

The team behind this log works on platform, SRE, and backend development. There are no individual names or biographies on this page because the log presents itself as what it is: a shared work notebook, peer-reviewed before publication. What you can verify is the method: configuration snippets, scheduler and kubelet events, and metrics that can be reproduced in your own cluster.

Origin of the material

Cases seen in active clusters

The examples of poorly calibrated requests and limits come from real incidents: pods restarting due to OOMKilled, CPU throttling that does not appear in the application logs, and values copied from staging without reviewing the production load.

Review method

Before publishing, it is reproduced

Every manifest that appears in an entry is applied to a test cluster before being cited. If the snippet does not explain the problem it claims to explain, it is rewritten or discarded. Configurations that only work on paper are not published.

Editorial independence

No sponsorship or agreements

Comparisons of cluster monitoring tools are made using the versions the team uses daily. No brands pay to appear better positioned, and when a tool has a specific limitation, it is stated.

Who we write for

Platform, SRE, and backend teams

The tone assumes you already know what a pod is and what a node is. What we contribute are the details that are not in the official documentation: how to read a kubelet event, which metric to look at before touching a limit, and which errors recur when migrating legacy services.

Terminal with Kubernetes manifests and resource usage metrics on screen

Kubernetes in production: resource limits that actually prevent outages

When a pod restarts for no obvious reason, it is almost never the code. This review covers poorly calibrated requests and limits, kubelet events, and the signals worth checking before touching the numbers.

Monitoring dashboard with metric charts and event logs Latency dashboard

The spike that appears right before the restart

Containers and services deployed in a cluster with startup logs Kubelet events

OOMKilled does not always mean what it seems

Screen with configuration files and a highlighted change plan Example manifest

A snippet with requests and limits listed separately

Flow diagram of messages between producers and consumers in a queue Node diagram

How load is redistributed when a node degrades

Resource usage chart with a breakdown by category Usage per container

CPU throttling: the other silent suspect

Authorship Technical log

Kubernetes in production: resource limits that actually prevent outages

Independent technical log, without sponsorship

This entry about resource limits in Kubernetes is signed by the Buckingham Cloud editorial team, the same group of engineers who document what they see working in production. There are no individual profiles or inflated credentials: what is published here comes from manifests, kubelet events, and observability dashboards that are reviewed before writing. If anything in the text cannot be supported by that evidence, it is corrected or marked as a sample scenario.

Each log entry includes configuration snippets, dashboard screenshots, and tool comparisons without sponsorship. Tags such as networking, storage, or CI/CD are used to locate related material when the topic overlaps with another.

Write to the editorial team or return to the blog index.

Cookie settings

We use cookies to keep the site stable, remember basic options, and understand which pages are useful. You can accept, reject, or review the settings before continuing.